
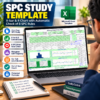
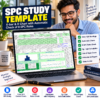
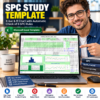


SPC Study Template for Microsoft Excel | X-bar & R Control Charts | Automatic 8 SPC Rules Check | Cp & Cpk Calculation | Histogram & Quality Control Report

Original price was: $5.90.Current price is: $3.20.

You save $2.70 46% OFF
Weekend sale ends in 20% OFF
00Days
00Hours
00Mins
00Secs
This offer has ended. Refresh the page to see the latest price.
Buy with confidence
Secure Checkout PayPal & Razorpay · SSL encrypted
Instant Download Files ready right after payment
Easy Re-downloads Saved in your account
Ready to Use Easy to edit & customise
Fair Refund Policy Faulty file? We fix or refund
Real Human Support Reply within 24 hours
  • Download and open the Excel file.
  • Enter part details and specification limits.
  • Add dates, times, and 125 readings.
  • Review X-bar and R control charts.
  • Check automatic 8 SPC rules results.
  • Review histogram, Cp, and Cpk values.
  • Check out-of-specification readings.
  • Print the final report in A4 landscape format.
7-Day Fair Refund Promise
File faulty, not delivered or not as described? We'll fix it or refund you.
  • Working file or full refund
  • Real human support within 24 hours
  • Secure PayPal & Razorpay checkout
Read our Refund & Returns Policy
Add to Wishlist
Add to Wishlist
Handpicked for you

You may also like

eBooks & Guides The AI-Powered Professional – 50 Practical AI Tools, Workflows & Strategies to Work Smarter, Save Time & Grow Your Career
★ 5.0 (1)
Original price was: $7.90.Current price is: $3.99.
Spread the love
Trust Badge Image

Description

SPC Study Template for Microsoft Excel – Complete Statistical Process Control Tool

Improve your quality inspection and process monitoring with the SPC Study Template, a ready-to-use Microsoft Excel workbook designed for quality engineers, production engineers, process engineers, and manufacturing professionals. This template helps you organize measurement data, analyze process variation, monitor process stability, and prepare a complete Statistical Process Control (SPC) study in a single printable report.

Key Features of the SPC Study Template

1. Complete SPC Study on One Page

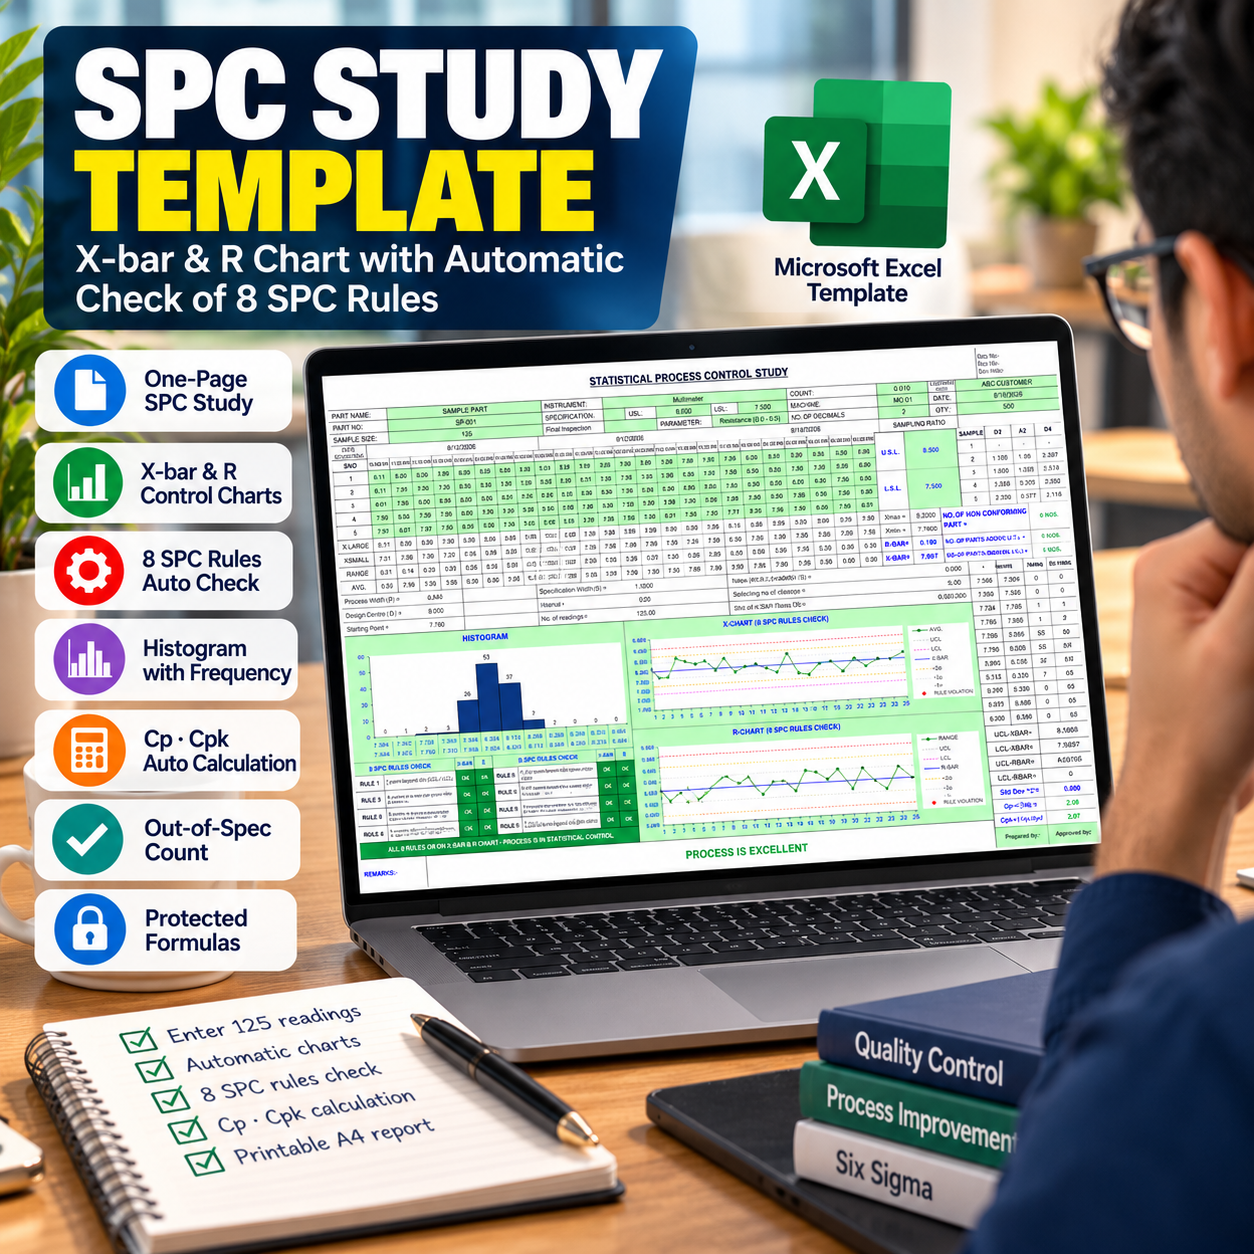
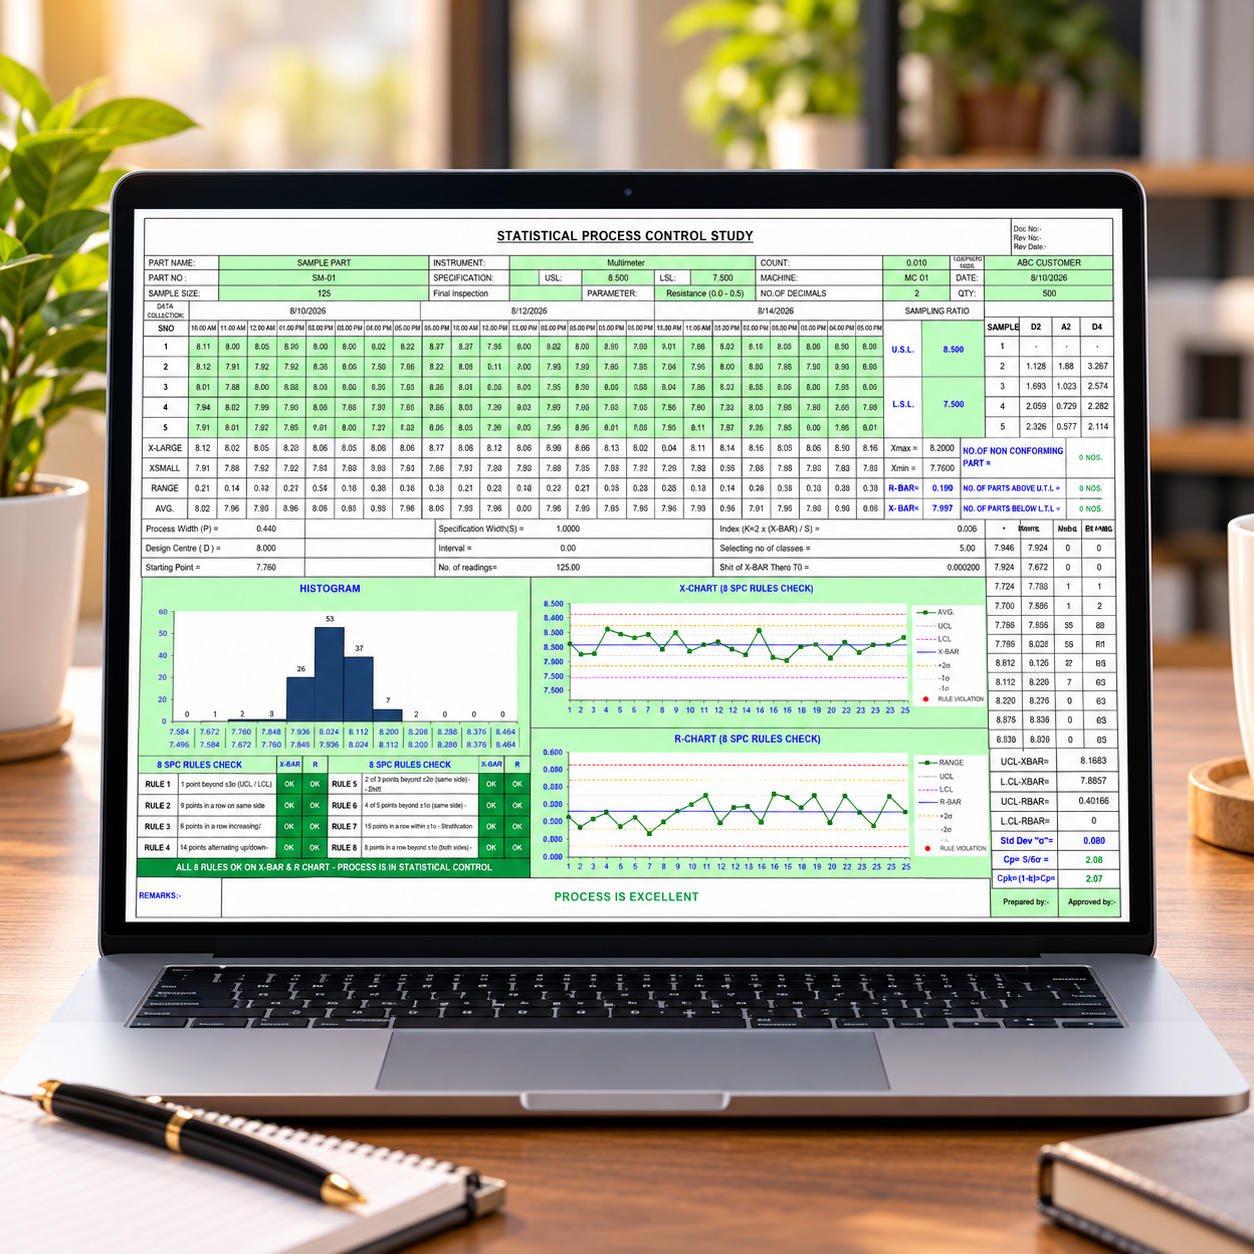
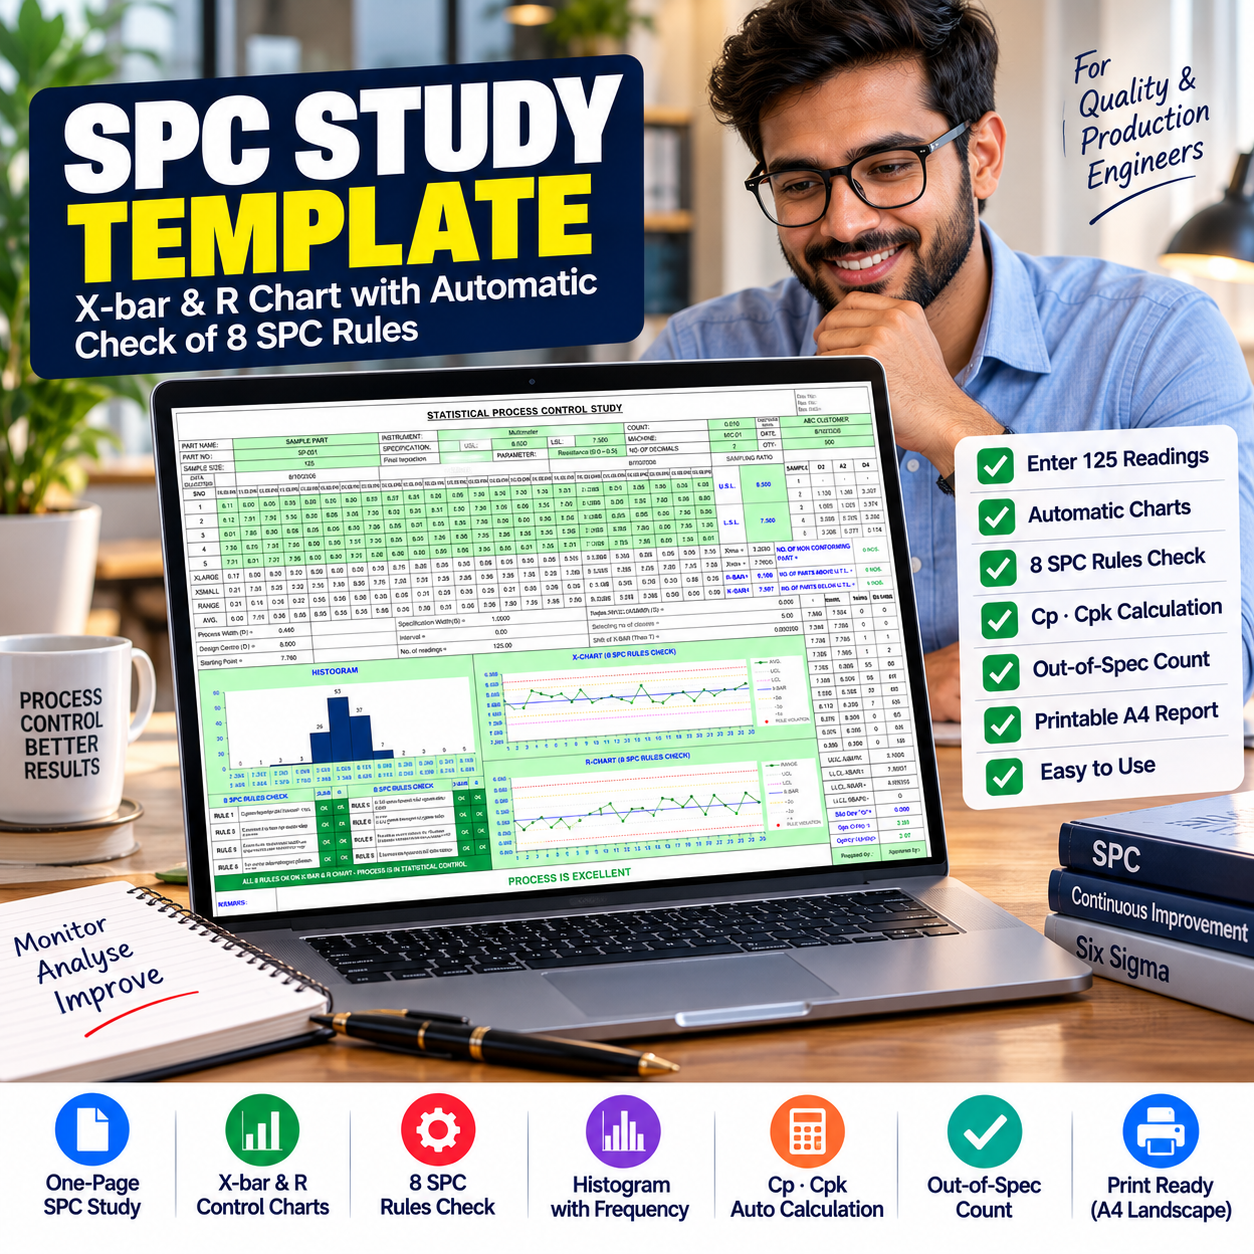
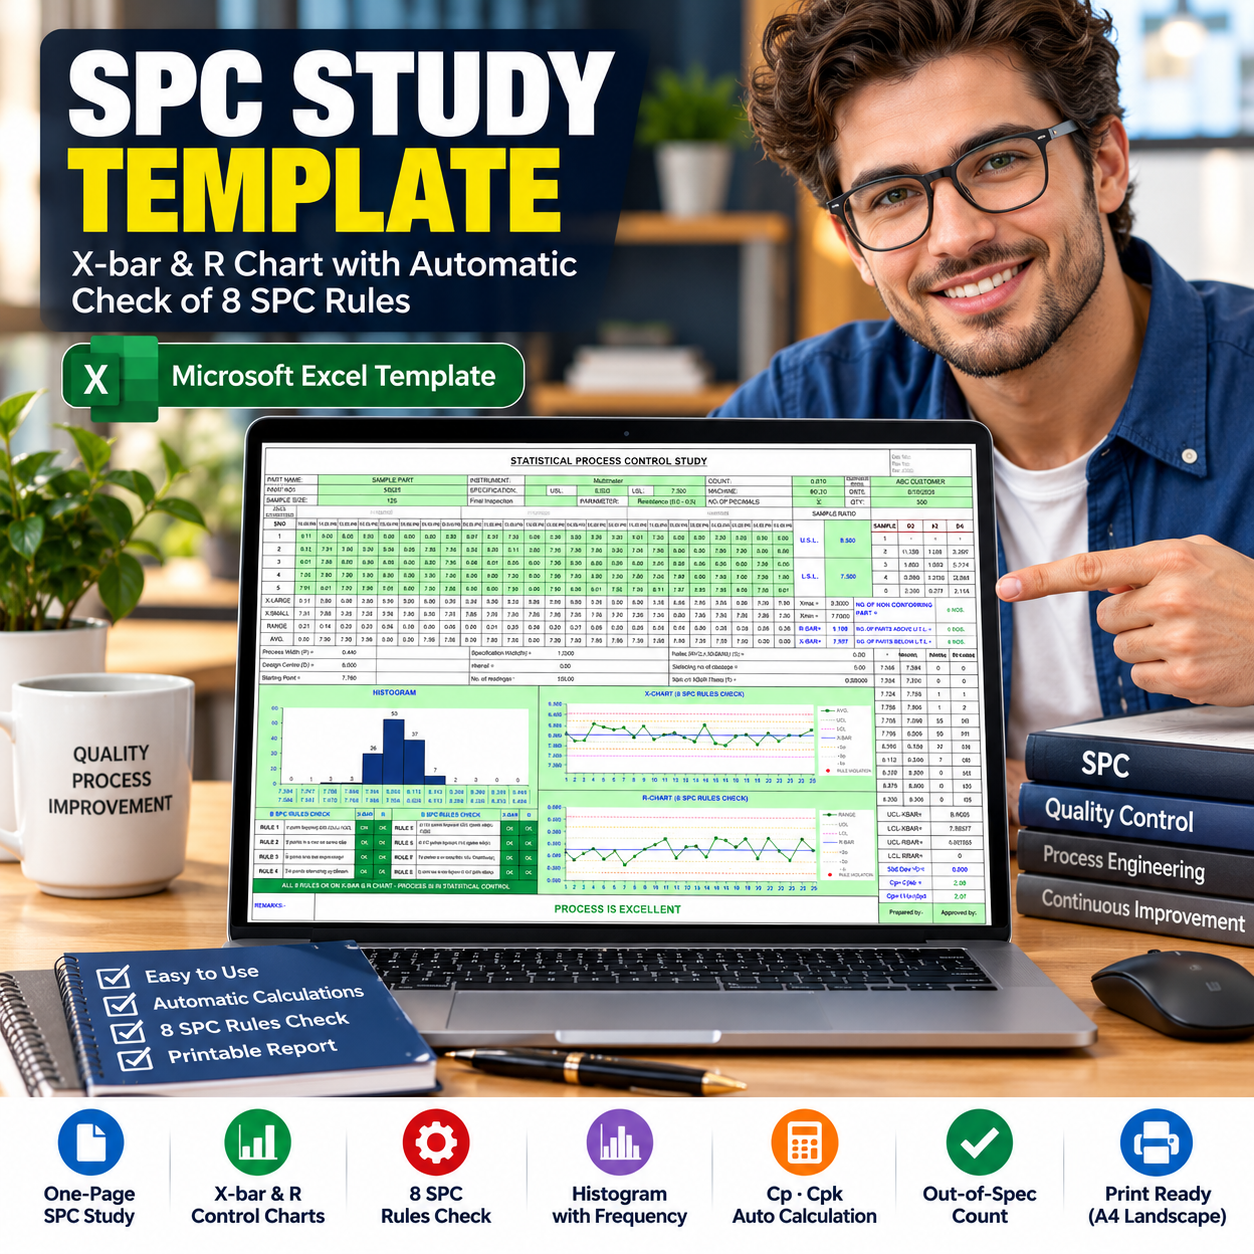
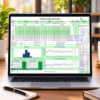
The SPC Study Template combines measurement readings, X-bar and R control charts, a histogram, process capability calculations, and SPC rule checks into one A4 landscape report. It helps you review important quality data in one organized worksheet.

2. Analysis of 125 Readings

Enter 125 measurement readings arranged into 25 subgroups of 5 readings each. Add your part details, specification limits, instrument information, dates, and other study parameters. The workbook uses this data to calculate the relevant SPC results automatically.

3. X-bar and R Control Charts

The template generates X-bar and R control charts using your measurement data. It calculates the center lines and control limits and displays additional ±1σ and ±2σ zone lines to help you analyze process variation and identify unusual patterns.

4. Automatic Check of 8 SPC Rules

The SPC Study Template checks eight SPC rules on both the X-bar and R charts. Each rule displays an OK or NOT OK result. When a rule is violated, the relevant chart point is highlighted in red and identified with its rule number, helping you locate potential process issues more easily.

5. Histogram with Frequency Data

Analyze the distribution of your measurements using the built-in histogram. The worksheet displays measurement intervals, frequency, and cumulative frequency, helping you understand how readings are distributed across the measured range.

6. Automatic Cp and Cpk Calculations

The workbook calculates standard deviation, Cp, and Cpk based on the entered measurement data and specification limits. It also provides a process capability remark to help you interpret the calculated results.

7. Out-of-Specification Count

The template counts readings that fall above the Upper Specification Limit (USL) or below the Lower Specification Limit (LSL). The count changes automatically when the measurement data changes, making it easier to identify readings outside the specified limits.

8. Protected Formulas and Structured Layout

The workbook protects calculation formulas, charts, and layout cells against accidental changes. Only designated input cells can be edited, helping preserve the structure of your SPC study.
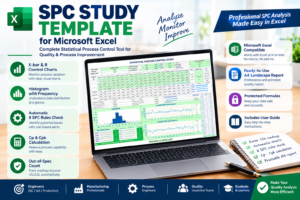
SPC Study Template

Who Can Use This Template?

The SPC Study Template is suitable for:

  • Quality Control (QC) and Quality Assurance (QA) engineers
  • Manufacturing and production engineers
  • Process and industrial engineers
  • Supplier quality and inspection professionals
  • Continuous improvement teams
  • Students and professionals learning Statistical Process Control
  • Manufacturing units preparing routine measurement studies

What Is Included?

  • One Microsoft Excel workbook (.xlsx)
  • SPC study worksheet with sample data
  • Separate “HOW TO USE” worksheet
  • X-bar and R control charts
  • Automatic eight-rule checking
  • Histogram with frequency information
  • Cp and Cpk capability calculations
  • Out-of-specification counts
  • PDF feature guide with usage instructions

Easy to Use – No Macros Required

The SPC Study Template works with Microsoft Excel 2010 or later on a computer. No macros or additional Excel add-ins need to be installed or enabled. Sample data is already included so you can explore the completed report before entering your own measurements.

Simply save a copy of the workbook, update the study information, enter the specification limits and measurement readings, review the calculated results, and print the report when required.
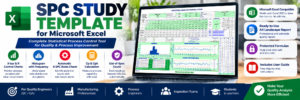
SPC Study Excel Template Infographic

Important Information Before Purchase

This workbook is designed for exactly 25 subgroups of 5 readings, totaling 125 readings. All 125 measurement cells must be completed for a correct study. The R-chart checks for SPC rules 5–8 are indicative because the ranges are not distributed symmetrically around the average range. The workbook is intended for use in Microsoft Excel; other spreadsheet applications may not display rule-violation points correctly.

Make your quality analysis more organized and efficient with the SPC Study Template, a practical Excel-based solution for measurement analysis, process monitoring, and quality reporting.

The AI-Powered Professional – 50 Practical AI Tools, Workflows & Strategies to Work Smarter, Save Time & Grow Your Career – Tech Mahadev

Reviews

There are no reviews yet.

Be the first to review “SPC Study Template for Microsoft Excel | X-bar & R Control Charts | Automatic 8 SPC Rules Check | Cp & Cpk Calculation | Histogram & Quality Control Report”

Your email address will not be published. Required fields are marked *

Frequently Asked Questions

Everything you need to know about SPC Study Template for Microsoft Excel | X-bar & R Control Charts | Automatic 8 SPC Rules Check | Cp & Cpk Calculation | Histogram & Quality Control Report

After purchasing SPC Study Template for Microsoft Excel | X-bar & R Control Charts | Automatic 8 SPC Rules Check | Cp & Cpk Calculation | Histogram & Quality Control Report, you will receive the digital files, resources, or content mentioned on the product page. Please check the product description for complete details.
Your digital product will be delivered electronically. After successful payment, you can access your purchased files through the download link provided on the website and/or in your order confirmation.
Digital products are normally available immediately after successful payment. If the download link does not appear, please check your order confirmation or contact our support team.
The file format depends on the specific digital product. Available formats such as PDF, ZIP, DOCX, XLSX, PPTX, or other formats are mentioned on the product page.
Yes. Most of our digital products can be accessed on smartphones, tablets, laptops, and desktop computers, depending on the file format and software required.
Some digital products may require specific software or applications. Any important software or compatibility requirements will be mentioned on the product page.
If your purchase includes downloadable files, you may be able to access the download again through your order account or download link, subject to the product's download limitations.
If updates are included with the product, eligible customers may receive access to updated versions. Please check the individual product description for update information.
Digital products are intended for personal use unless otherwise stated. Please do not redistribute, resell, share, or commercially distribute the files without permission.
Because digital products are delivered electronically, refunds may be subject to our digital product refund policy. Please review the refund policy before purchasing.
If you experience any problem with your download link, please contact our support team with your order details. We will help you access your purchased product.
Yes. Digital products can generally be purchased and accessed internationally, provided that the required payment method, internet connection, and compatible software are available.

Customer Highlights

Customer feedback highlights for SPC Study Template for Microsoft Excel | X-bar & R Control Charts | Automatic 8 SPC Rules Check | Cp & Cpk Calculation | Histogram & Quality Control Report

★★★★★
“I am impressed with how well everything is organized.”
🇺🇸 Lauren from Seattle, USA
Sample customer highlight
★★★★★
“A very good purchase. It delivered exactly what I expected.”
🇮🇳 Pooja from Pune, India
Sample customer highlight
★★★★★
“Very satisfied with my purchase. The quality is excellent.”
🇺🇸 Amanda from Phoenix, USA
Sample customer highlight
★★★★★
“Very useful and easy to use. Definitely worth it.”
🇮🇳 Nikhil from Bhopal, India
Sample customer highlight
★★★★
“Very useful and practical. It saved me a lot of time.”
🇺🇸 Mark from Atlanta, USA
Sample customer highlight
★★★★★
“Everything was exactly as described. Highly satisfied.”
🇺🇸 Daniel from San Diego, USA
Sample customer highlight

Shopping cart

0
image/svg+xml

No products in the cart.

Continue Shopping